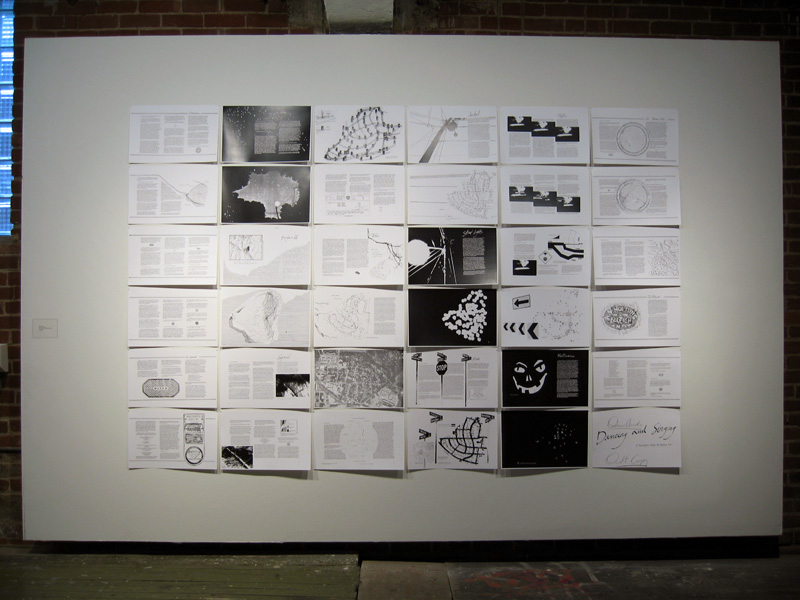
Denis Wood is a cartographer who had been working on the atlas of the Boylan Heights, North Carolina since the mid 1970’s. The portions of completed atlas have never been published in their entirety, but it is known as Dancing and Singing: A Narrative Atlas of Boylan Heights.
However this atlas is not merely a display of geography but contains many differing unique examples of creative maps attuned to their surrounding area. They show maps of night, crime, fences, graffiti, textures, autumn leave, the underground and stars etc. They are diverse creations that take influence from anything and everything and were first created by Wood to try and encourage students to focus on location specifics and not the geography as a whole. The atlas of Boylan Heights takes all the aspects that make up the designers neighbourhood and illustrates them on separate maps. The reason that the maps are black and white copies is due to the fact that the atlas was intended to be given out freely to the residents of Boylan heights to help show them what built up their town. So the production costs had to be kept to a minimum. 
The pumpkin map illustrates the houses in the neighbourhood that saw fit to display a pumpkin on their front porch. Their composition relies on the layout of the street and they are shown as individuals through the many differing horror faces that the residents carved into them. This is a much more indicative approach of the street and works in this format more so than if the pumpkins had been represented using the same symbol or ‘scary face’.

The composition regarding the star map of Boylan heights is really interesting to me and is attractive through the use of framing. Tree’s and houses are silhouetted around the edges of the star map with a portioned piece of sky being located in the middle. Texture is a huge part of the piece, with the borders being stark black and the night sky itself being very tactile indeed.
‘What we were trying to do was a kind of fish-eye view, splashing up out of the neighborhood into the night sky. Using an atlas of star positions we improved our plotting of the night sky. This was not easy either because the projection we were making and the projection the star atlas used were very different. We pulled the rest of the stars from Galileo’s Sidereus Nuncius both because they are so beautiful and because I liked the way Galileo integrated text and image. Crawford did the drawing, laid out the spread, and did the photomechanical work.’ – Denis Wood.

I think the map that gives the most indicative representation of Boylan Heights in terms of Wayfinding is the Sign Map which composes every sign within the neighbourhood onto the canvas, displayed in a similar way as to how they would appear in the real world. The background is white, bringing all of the signs into focus more easily and the main street’s and roadways are instantly recognizable for the thicker mass of symbols that can be found there. The use of a blank background that has no streets displayed or underlying information gives a much more cleaner representation. Any other information would have been unnecessary as the impression of the place is easily conveyed as it is.
http://makingmaps.net/2008/01/10/denis-wood-a-narrative-atlas-of-boylan-heights/
